Read the situation.
A shared view to follow traffic and identify the information that needs further attention.

Trenitalia · Tactical dashboard
A 3D dashboard to explore railway network conditions, inspect train information and simulate operating scenarios.
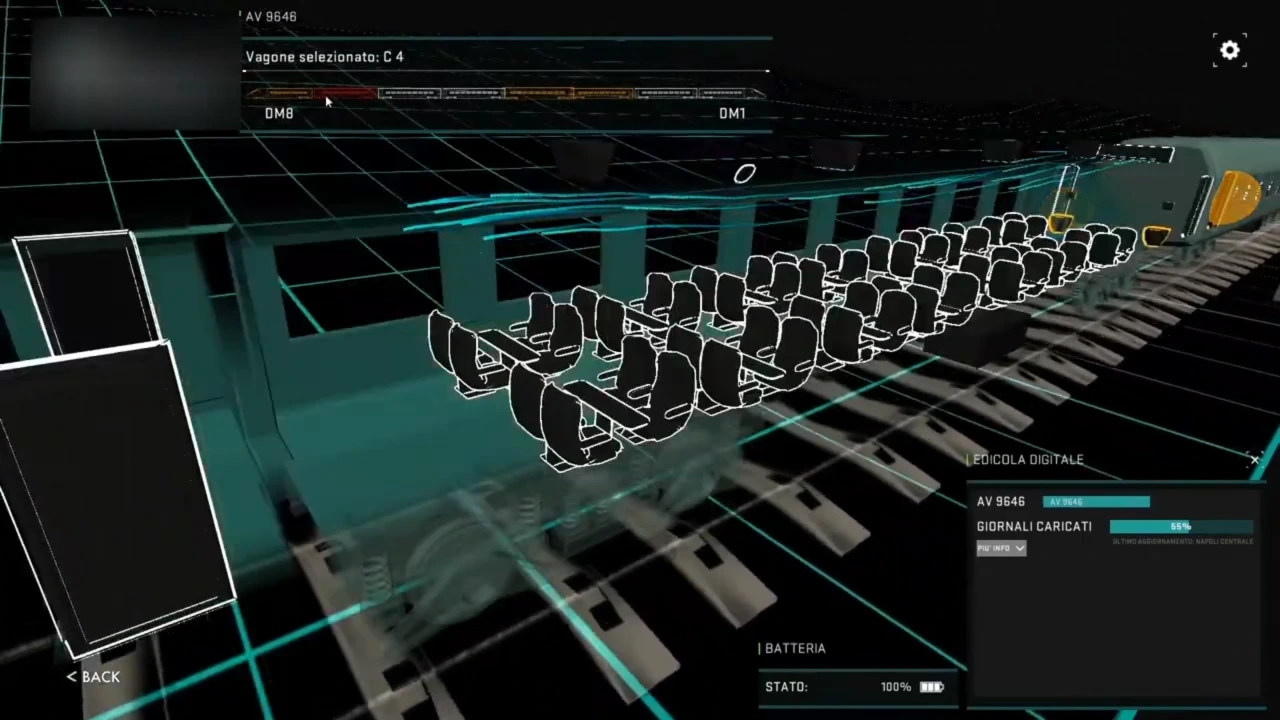
Understanding a railway system takes more than observing an isolated data point. Train positions, carriage conditions and traffic disruptions gain meaning when they are seen together.
The Trenitalia tactical dashboard brings 3D representation and operating information into a decision support interface. From a network view to an individual train, the aim is to make context explorable.
A shared view to follow traffic and identify the information that needs further attention.
Explore a train and its components, with contextual data such as carriage temperature.
What-if simulations and alerts help connect an event with its operational context.
The 3D model becomes a way to read the system: select an element, inspect its state and return to the wider picture. The project combines dashboards, data visualisation, alerts and what-if simulation.
Experience design connects two scales: the overall system, for orientation, and the individual asset, for investigating a specific condition. Interaction makes moving between them explicit.
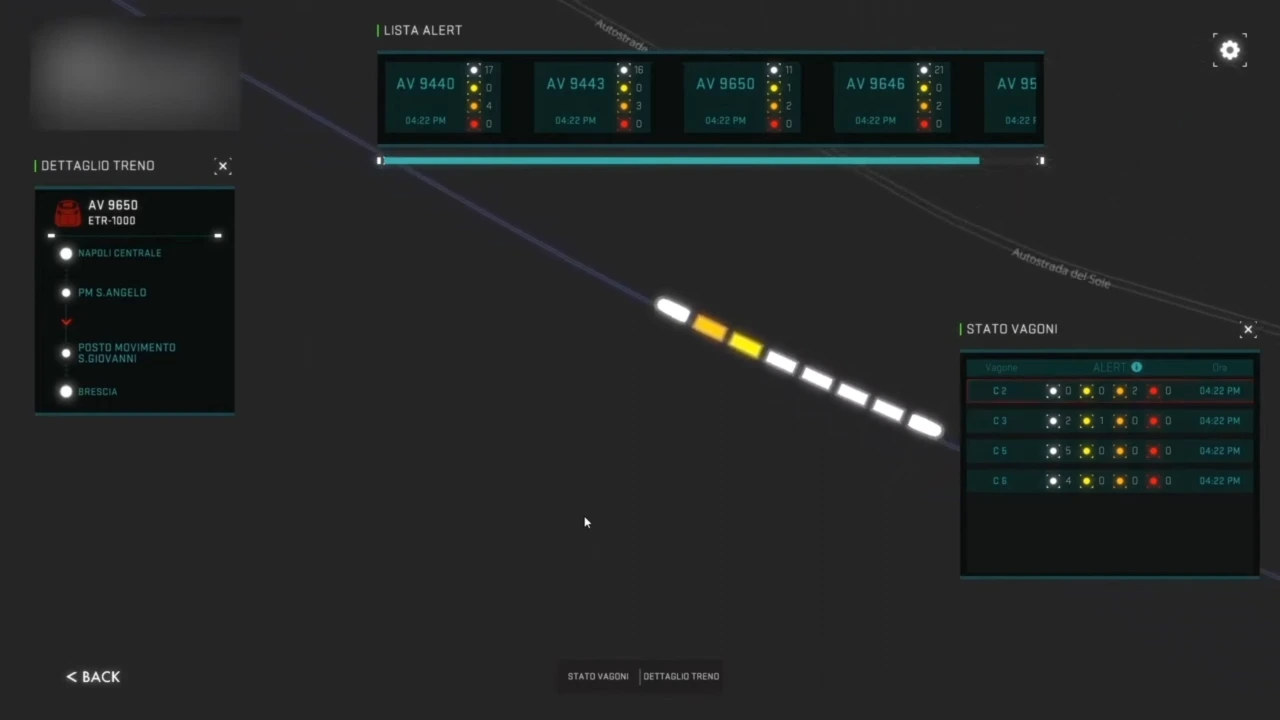
A digital twin’s value depends on the question it helps answer. Here, visualisation and simulation provide a shared reference for understanding scenarios and supporting control-room work.
Let’s start with the users, available sources and operating situations you need to understand.